In today’s fast-paced digital world, users expect applications to be lightning-fast, reliable, and always available. No matter how feature-rich an app may be, if it slows down, freezes, or crashes under heavy load, users quickly lose trust in it. This is where performance testing steps in. It ensures that applications can handle real-world conditions with stability, speed, and efficiency.
To achieve this, QA teams rely on powerful tools designed to simulate different workloads, detect bottlenecks, and optimize system performance. In this blog, we will explore the top 5 performance testing tools, their purpose, and their use cases.
There are a large number of performance testing tools available in the market. It depends on the project's requirements to determine which one to choose for testing.
So, the top 5 performance testing tools are listed here.
1. Apache JMeter
Purpose:
JMeter is a Java-based open-source performance testing tool that is used for performing load, stress, and volume testing of APIs and databases. Its primary goal is to benchmark backend services of the application and identify bottlenecks.
Advanced load testing features controlling concurrency and RPM. It supports pre- and post-setups with user input data, produces extensive multipage HTML reports, enables users to perform tests remotely with the CLI version, and provides not only codeless but also code-based scripts with JSR223 processors.
JMeter master-slave distributed testing is used for a very heavy load that one machine cannot handle. JMeter instances (i.e., slaves) run the test in parallel, and one machine controls them.
Use cases:
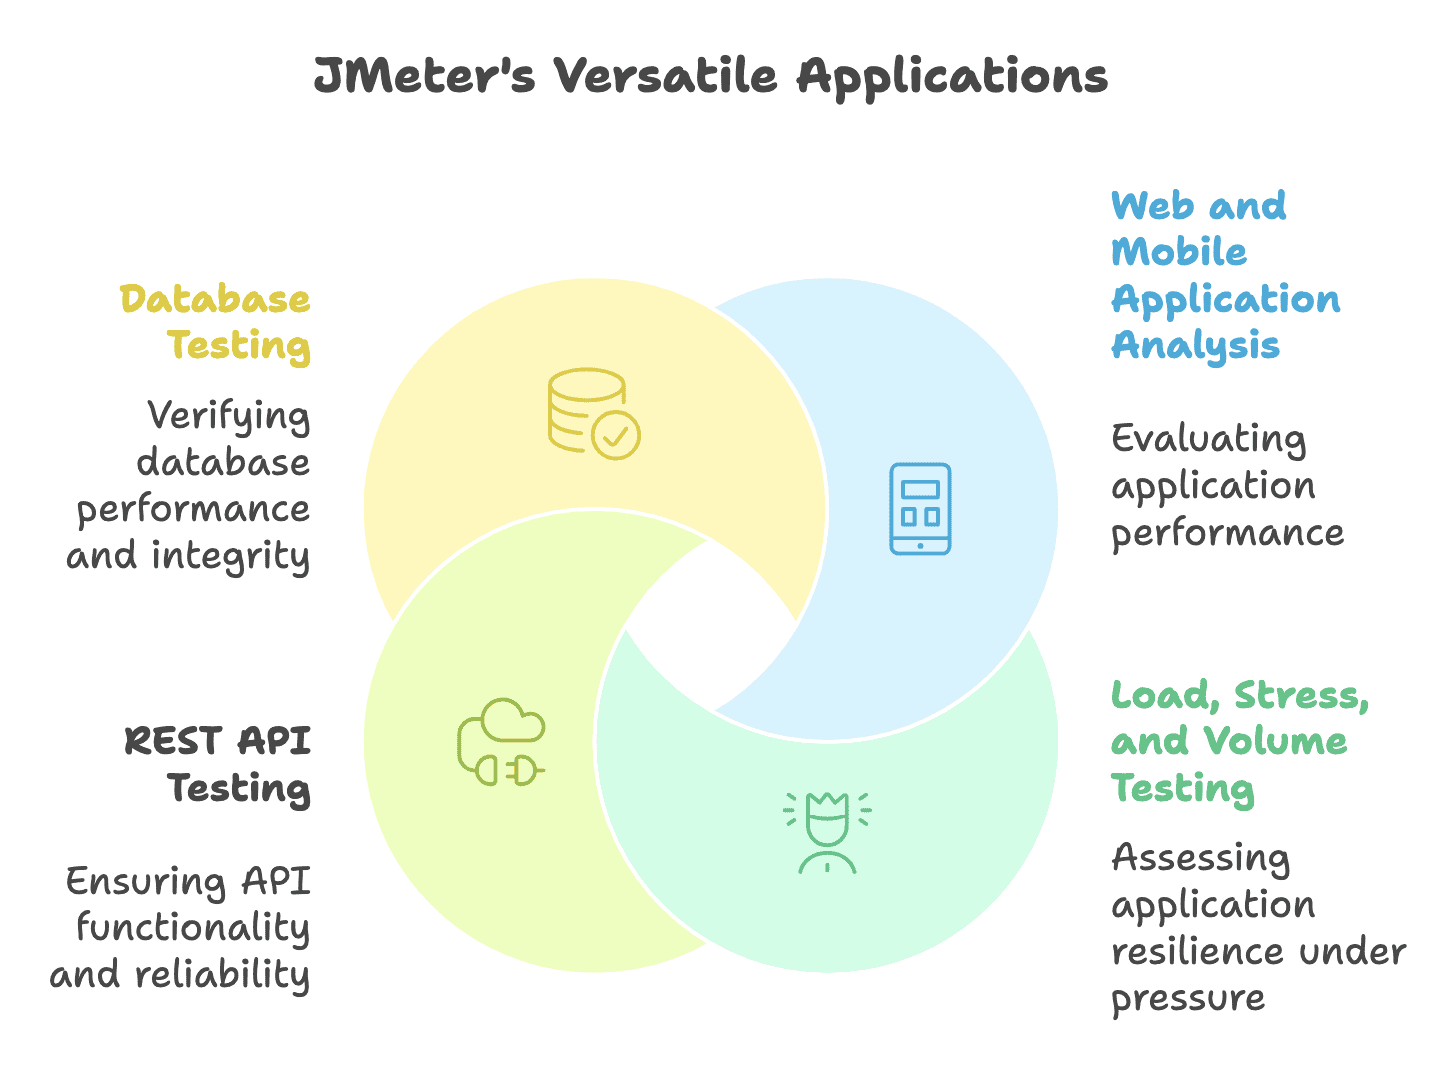
Analyze the performance of web and mobile applications.
Perform load, stress, and volume testing.
Test REST APIs.
Perform database testing.
2. BlazeMeter
Purpose:
BlazeMeter is a cloud-based performance testing tool that is used to check large-scale loads and measure application performance.
K6 is an open-source modern performance testing tool. It is designed for performance testing on web applications, APIs, and microservices.
Strength:
JavaScript-based scripting.
Integration with monitoring tools like Grafana. It provides detailed reports via Grafana and Prometheus.
Provides a CLI-based version to execute locally and remotely.
Provides high-performance load testing.
Ideal for CI/CD integrations.
Use cases:
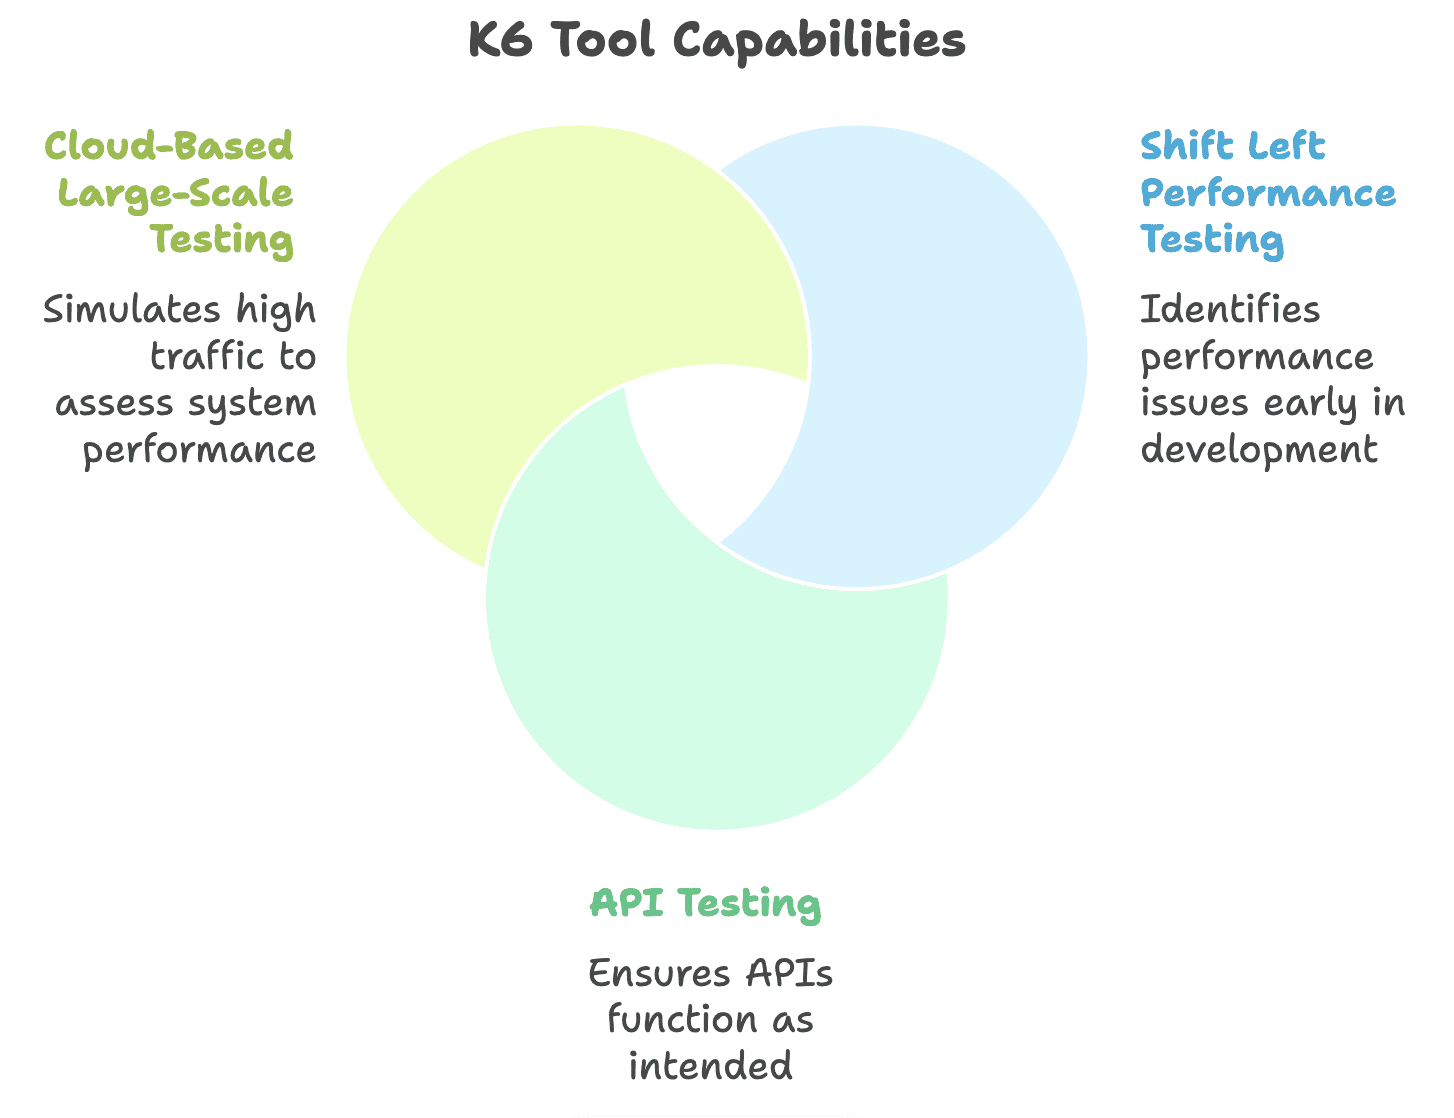
Shift-left performance testing.
API testing.
Cloud-based large-scale testing.
5. Lighthouse
Purpose
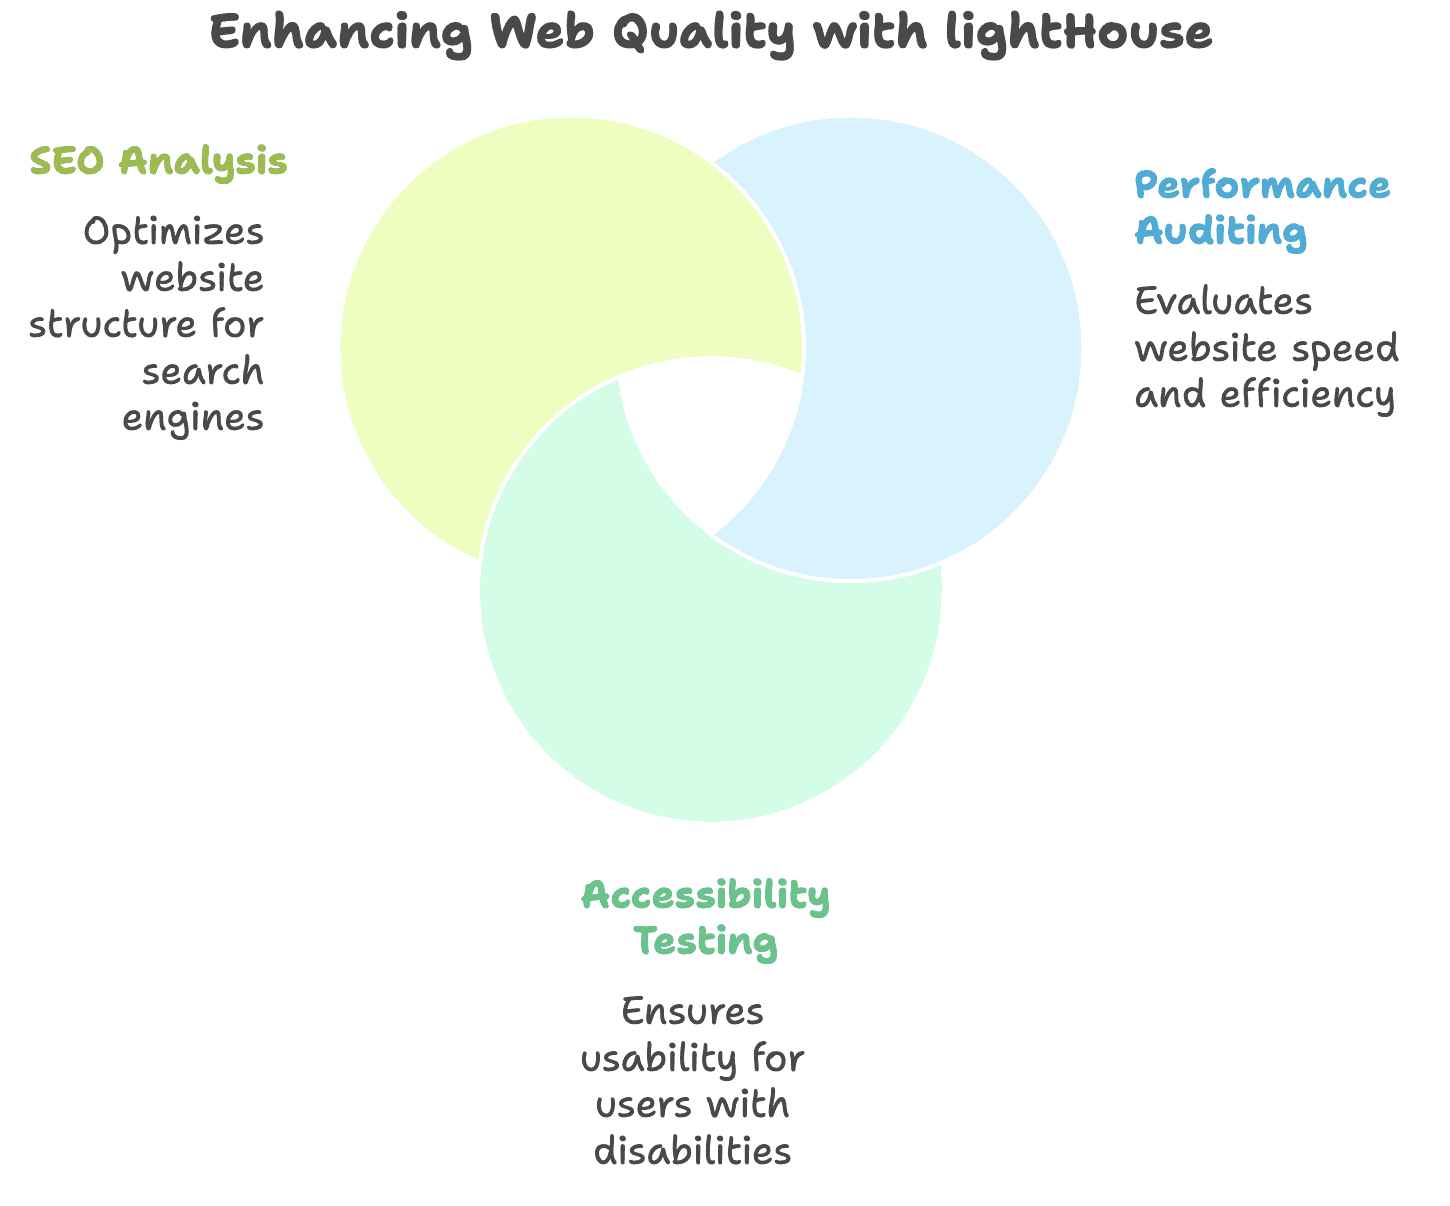
It is an open-source automated tool used for improving the quality and performance of web pages.
Strength
Free and open-source.
Provides multi-dimensional audits that include performance, accessibility, SEO, and PWA compliance in a single run.
Supports cross-platforms.
Use cases
Performance auditing.
Accessibility testing.
SEO analysis.
Comparison Table
The comparison table provides a quick overview to understand each tool, including its type, key strengths, and use cases.
Tool
Type
Key Strength
Use
JMeter
Open-source
Benchmark backend services
Load, stress, and volume testing
BlazeMeter
Enterprise
Supports multiple open-source testing tools
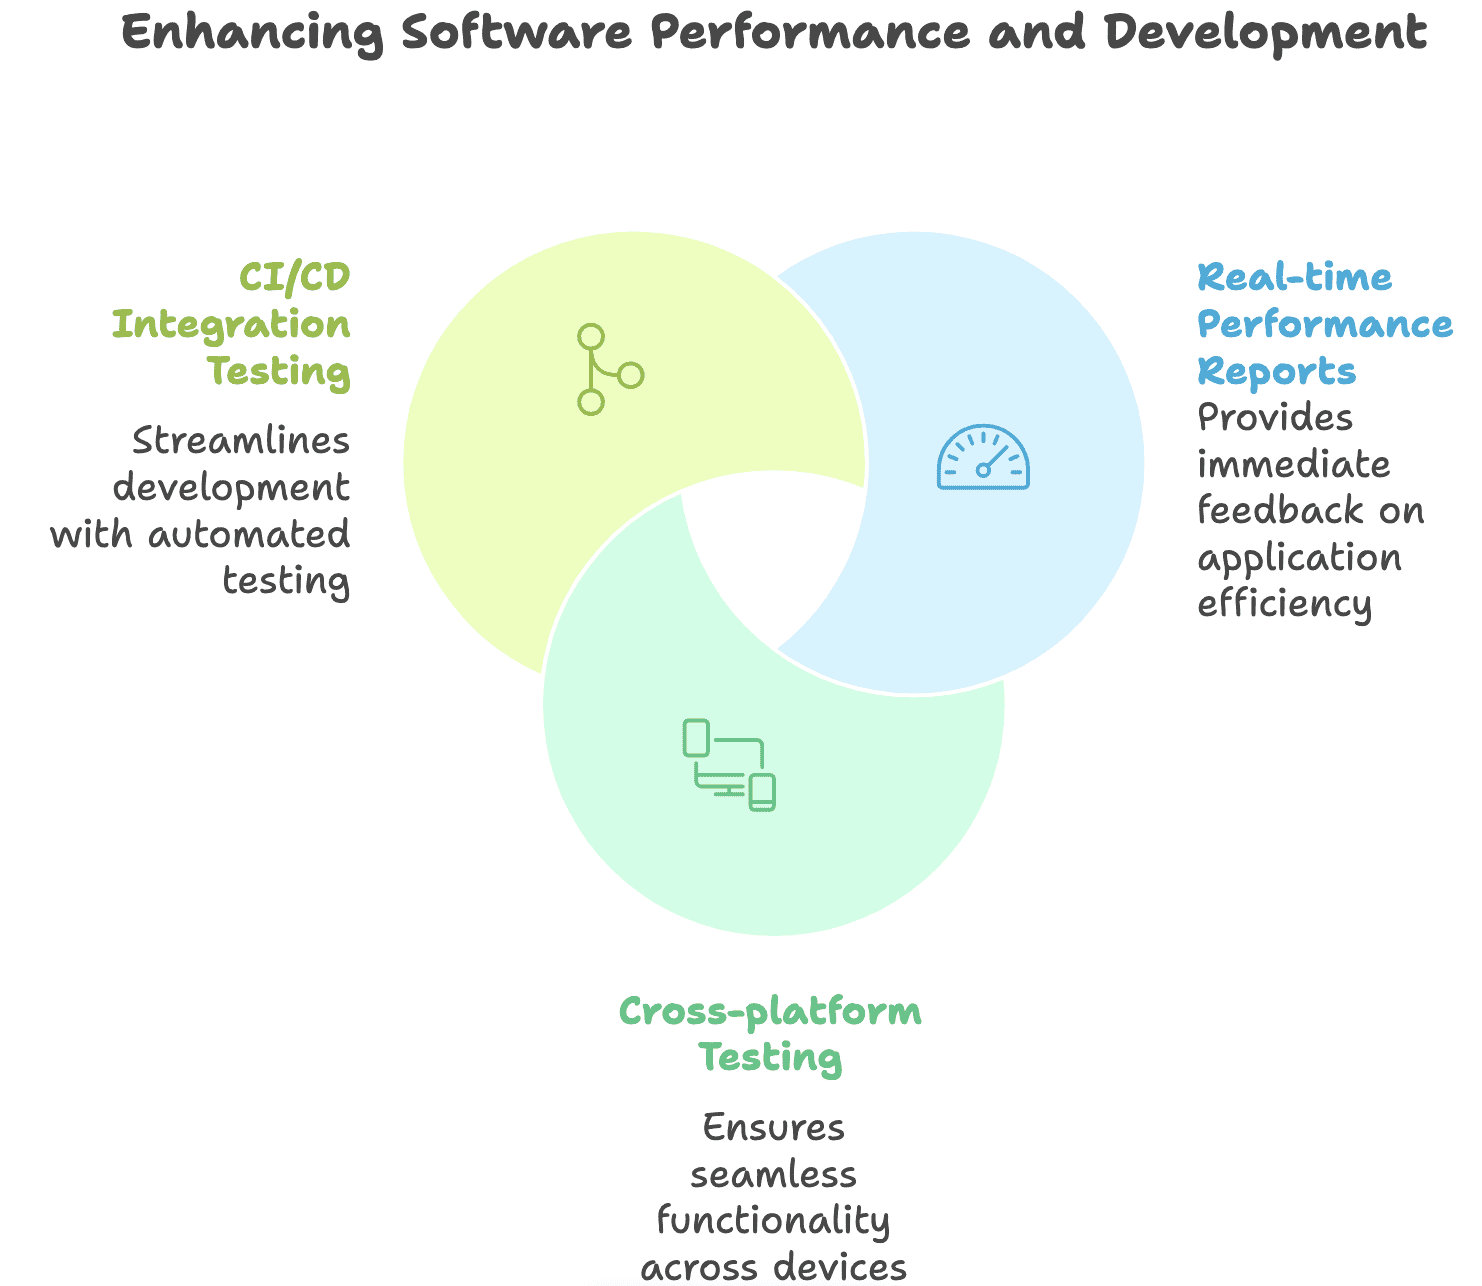
Real-time performance reports
Gatling
Open-source
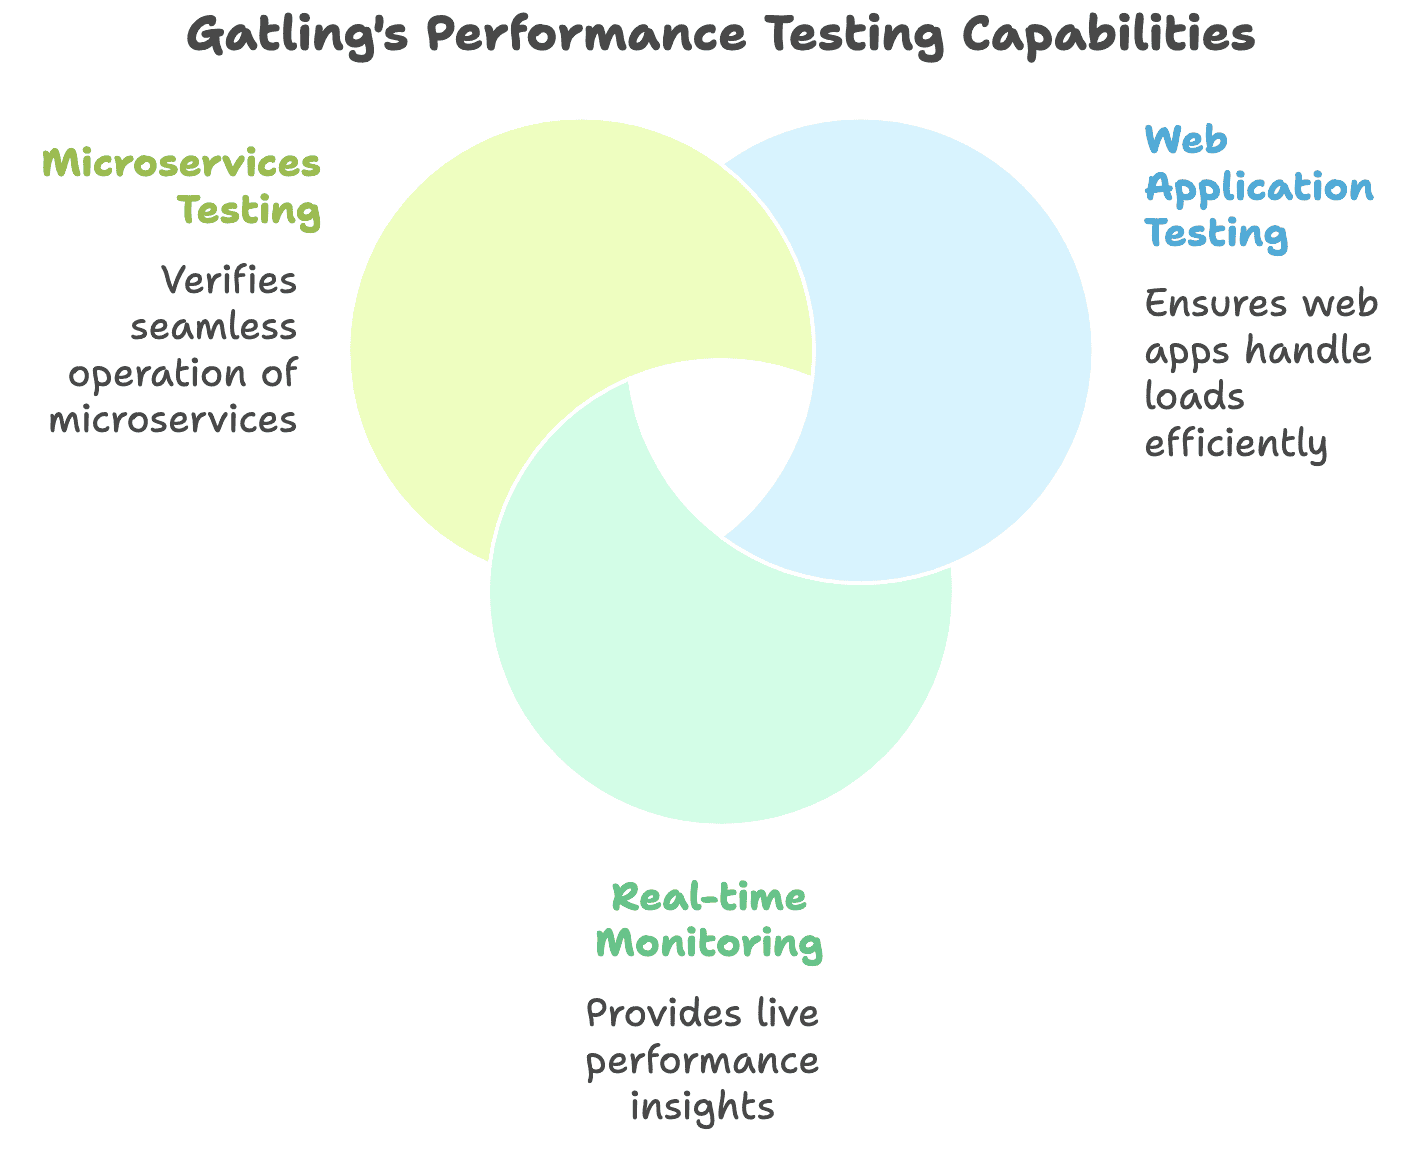
Testing for high traffic loads, API testing, and microservices
Load and API testing
K6
Open-source
Integration with monitoring tools like Grafana
Cloud-based large-scale testing
Lighthouse
Open-source
Multi-dimensional audits
Accessibility testing, performance auditing, SEO analysis
Evaluating Criteria for Choosing the Right Tool
Choosing the right tool for performance testing is crucial, as it leads to accurate results, high quality, and a smooth user experience.
Here are some of the key factors to consider when choosing the right tool:
Protocol-based testing: Ensure that the tool supports the protocols your software application uses (e.g., HTTP, HTTPS, WebSockets, FTP) to simulate user interactions accurately.
CI/CD integrations: Ensure that the tool integrates with CI/CD pipeline tools (such as GitLab, Jenkins, and Azure DevOps) for automated and continuous performance validation.
Cost and licensing: Select a tool based on your budget. If the budget is low, there are open-source tools available. If higher, enterprise tools are also an option.
Scalability and load testing: While most tools can replicate high loads, evaluate how efficiently they do so in terms of cost and resource utilization. The ideal tool should scale to your expected load without demanding unnecessary infrastructure or expensive licenses.
Reporting capabilities: Choose a tool that provides detailed reporting and analytics capabilities. The reports should include:
Requests per second (RPS)
Concurrency
Ramp-up time
Traffic
Throughput
CPU usage
Memory usage
Requests per minute (RPM)
Application support: Choose a tool that supports your application type (web, mobile, or both), as this affects running accurate and realistic performance tests.
Scripting language: Check that the scripting language is suitable for your team and the tool.
Performance analysis capabilities: Choose a tool that provides advanced analysis capabilities beyond standard metrics. It should enable correlation of results with system metrics (CPU, memory, DB queries) and support identifying root causes of bottlenecks efficiently.
While performance testing focuses on speed and stability, device testing ensures that the same level of performance holds true across different devices and environments.
In the End
Performance testing is very important; it is no longer optional, as it ensures that an application is stable and reliable. Selecting the right tool for performance testing is equally important.
Each of the tools we’ve discussed has its own strengths, making them suitable for different project needs. The key is to choose the one that aligns best with your application’s requirements, team expertise, and business goals.
By investing in performance testing, organizations not only prevent costly failures but also build user trust and achieve long-term success.


 Add as preferred on Google