Add as preferred on Google

How a Repository Health Dashboard Helped Open edX Patch certifi in 48 HoursRead More

Third-party ad scripts that fill local storage, poll constantly and leak memory can be caught by testing long sessions before integration and setting limits in vendor SLAs.
Approve a vendor only after a long-session trial stays within thresholds set from your own baseline.
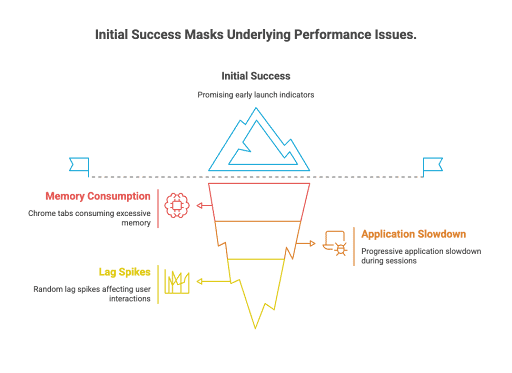
We chose a global AdTech provider largely for its reach in China, where our app has a significant user base. The integration looked fine at first. Then complaints started, and the cause was the provider's scripts, which filled local storage with entries they never removed, polled their servers constantly and pushed browser memory to 3 to 7 GB in long sessions.
Our main lesson is to test memory, storage and polling over long sessions before integrating any ad script. Those limits then belong in vendor SLAs. This case study covers how we traced the problem, which red flags to watch for, a technical due diligence checklist and the defensive monitoring and polling code we now use.
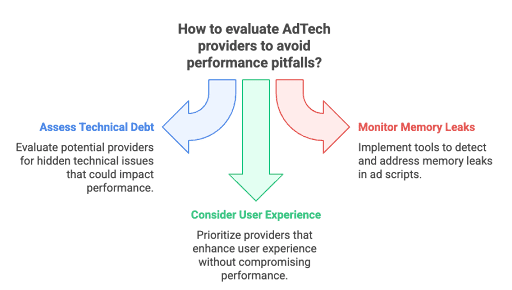
The first complaints looked isolated. Once our engineering team inspected affected users' browsers, the problem turned out to be systemic, and the trail led to the AdTech provider's client-side scripts.
The scripts wrote entries into every visitor's local storage and never removed a single one.
// What we found in users' browsers:
_-1001280373: {"value":9,"created":1748528555584}
panorama_id_12847: {"zone_data":"...", "timestamp":1748528555584}
user_zone_china_8472: {"active":true, "created":1748528555584}
ad_frequency_cap_945: {"impressions":47, "last_reset":1748528555584}
// ...and hundreds more entries per session
Five problems made each other worse:
Every AdTech provider we consider now goes through the checks below, all of them drawn from what this integration taught us.
Slow the decision down if you see these:
Once a script is live, these symptoms point to it as the source of a problem:
The performance part of the checklist covers four things:
First, find out whether the vendor polls from the client or the server. Each approach needs its own checks.
If the vendor polls from the client, check these behaviors:
For server-side polling, look at infrastructure:
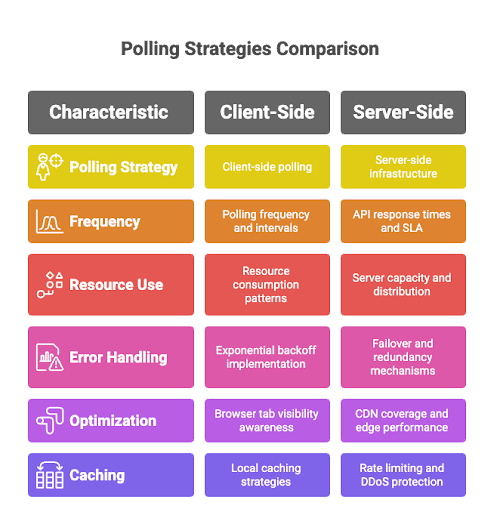
For a global rollout, measure how the vendor performs in each target region separately:
The first pattern is memory monitoring. Before critical operations, the app checks memory usage, and when it crosses a threshold it shows a friendly "refresh for better performance" prompt that points people to a fix, so nothing crashes silently.
function monitorMemoryUsage() {
    if ('memory' in performance) {
        const memInfo = performance.memory;
        const memoryUsage = {
            used: memInfo.usedJSHeapSize,
            total: memInfo.totalJSHeapSize,
            limit: memInfo.jsHeapSizeLimit
        };
        if (memoryUsage.used > MEMORY_THRESHOLD) {
            reportPerformanceIssue('high_memory_usage', memoryUsage);
        }
    }
}
MDN Web Docs (Performance: memory property, 2026) describes performance.memory as a non-standard, legacy and deprecated property that works only in Chromium-based browsers, and notes that its figures can overstate or understate real usage, for example when workers or cross-site iframes run in separate heaps. MDN names Performance.measureUserAgentSpecificMemory() as the intended replacement. Treat this check as a rough signal in Chromium browsers only.
The second pattern is controlled polling, and you may need to build it yourself. Vendors should explain their polling strategy upfront. Require visibility-aware polling with exponential backoff, and if they can't answer or their approach turns out to be aggressive, wrap their polling in your own manager that detects tab visibility and keeps intervals at 30 seconds or longer, which protects your users' resources.
class AdPollingManager {
    // startPolling, pausePolling and the consecutiveFailures updates are left out for brevity
    constructor(baseInterval = 60000) { // Start with 1-minute intervals
        this.baseInterval = baseInterval;
        this.isVisible = !document.hidden;
        this.consecutiveFailures = 0;
        this.initVisibilityListener();
    }

    initVisibilityListener() {
        document.addEventListener('visibilitychange', () => {
            this.isVisible = !document.hidden;
            if (this.isVisible) {
                this.startPolling();
            } else {
                this.pausePolling(); // Critical: Stop when tab is inactive
            }
        });
    }

    calculateBackoffInterval() {
        // Exponential backoff: 1min → 2min → 4min → max 15min
        return Math.min(
            this.baseInterval * Math.pow(2, this.consecutiveFailures),
            900000
        );
    }
}
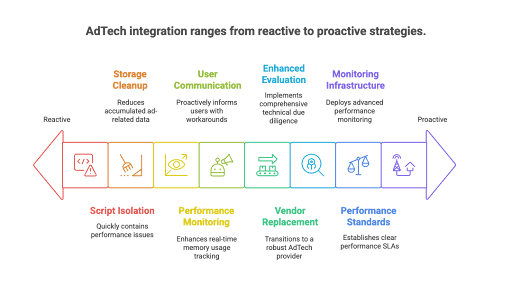
Beyond those two patterns, we put these safeguards around every third-party script:
First came immediate fixes to protect users:
Then we made longer-term changes to how we choose and govern vendors:
The migration produced these results:
Put memory and polling monitoring in place before an ad script goes live, so problems surface during testing and never get as far as your support tickets. Third-party leaks like ours stay hidden until sessions run long.
Once engineering overhead and user churn are counted, the cheapest AdTech option is rarely the most cost-effective one. Technical evaluation deserves equal weight with business metrics.
A worse user experience can quickly offset what the ads earn, and remediation after launch costs far more than a proper evaluation upfront. Budget for the evaluation first.
Approve an AdTech vendor only after a long-session trial keeps memory use, local storage growth and polling frequency inside your limits. For us, that meant at least 30 seconds between polls, scripts that clean up their own storage and no steady memory climb over sessions of 2 hours or longer. Your thresholds will differ. They depend on your app and audience, so set them from your own baseline before the trial starts.
Run the checklist above on the vendors already in your app. For the wider decision, see our framework for evaluating integrations, and if you'd rather have an outside team run these tests for you, we offer a third-party performance review.
Use it only as a rough signal. MDN describes performance.memory as non-standard, legacy and deprecated, it works only in Chromium-based browsers, and its figures can overstate usage when pages share a heap or understate it when workers or cross-site iframes use separate heaps. The intended replacement is Performance.measureUserAgentSpecificMemory().
No. A sandbox limits what embedded content can do, and an empty sandbox attribute applies all restrictions, but nothing in it caps memory, and each iframe brings its own memory and computing cost on top. Also avoid pairing allow-scripts with allow-same-origin for same-origin content, since together they let the content remove the sandbox.
Once every 30 seconds at most, under our internal guideline, which isn't an industry standard. Polling should also pause when the tab is hidden and back off exponentially after failures, doubling from a 1-minute base up to a 15-minute maximum, as the AdPollingManager sample above shows.
Remove the entries on a schedule. Match them by the key prefixes the scripts use and the timestamps they store. In the sample above, keys such as panorama_id_ and ad_frequency_cap_ carry created, timestamp or last_reset values, so a cleanup job can delete anything older than your retention limit.
...Loading Related Blogs
Trusted by top platforms for our transformative solutions and exceptional results: