Trusted by Market Leaders in Education, Travel, Finance and E-commerce since 2007


We put excellence, value and quality above all - and it shows


A Technology Partnership That Goes Beyond Code

“Arbisoft has been my most trusted technology partner for now over 15 years. Arbisoft has very unique methods of recruiting and training, and the results demonstrate that. They have great teams, great positive attitudes and great communication.”


Python for Data Science: Essential Libraries and Tools


Python is one of the most popular programming languages, and it’s easy to see why. It’s simple to learn, easy to read and can be used in many different fields. In this blog, we’ll talk about one of its key uses - data science. Python is a favorite in this field because of its powerful libraries, helpful community, detailed guides, and regular updates that keep it relevant.
If you’re thinking about starting a career in data science or switching to this field, it’s important to understand the problems data scientists solve, how they work, and the tools and libraries they use to get the job done.
What is Data Science?
Data science is a field that combines statistics and computing to find useful information and insights from data.
It is used in many areas, like machine learning, predicting trends, understanding images, processing language, and creating recommendations. While every data science project is different because of the problem it solves, the industry it’s in, or the type of data it uses, most projects follow a similar step-by-step process.
Data Science Lifecycle
Here are the five main stages of the data science lifecycle:
1. Data Collection: First, you gather data based on the problem you want to solve. This data can come from different sources like web scraping services, APIs, databases, files, or even live data streams.
2. Data Cleaning & Preparation: Next, the data is cleaned to make it usable. This means removing duplicates, fixing missing information, and standardizing formats so everything is consistent.
3. Exploratory Data Analysis (EDA): Once the data is ready, you study it using charts and statistics. This helps you find patterns, spot unusual data, understand relationships, and get deeper insights.
4. Modeling and Evaluation: After exploring the data, machine learning models are created and trained to solve the problem. These models are fine-tuned, tested for accuracy, and evaluated to ensure the best one is chosen for making predictions or decisions.
5. Model Deployment: Finally, the chosen model is used in real-life settings to provide predictions or insights.
Python makes it easier for data scientists to work efficiently through all these steps because its libraries and tools work perfectly together, a principle also embraced by leading ai and data science services.
Essential Python libraries and tools for Data Science
Python has a variety of libraries, ranging from basic to advanced, that are useful at each step of the data science lifecycle. Here are some key ones:
Stage | Basic Libraries | Advanced Libraries | Tools |
|---|---|---|---|
Data Collection | |||
Data Cleaning & Preprocessing | |||
Exploratory Data Analysis | |||
Modeling and Evaluation | LightGBM, TensorFlow, PyTorch, Yellowbrick, Hyperopt, Optuna | ||
Model Deployment |
Here are brief descriptions of some of the most essential libraries and tools, including Pandas, NumPy, Matplotlib, Seaborn, scikit-learn, and jupyter notebook:
1. Pandas: Used for gathering, cleaning, and analyzing data. It’s great for working with structured data like spreadsheets or semi-structured data like JSON files.
2. NumPy: Helps with handling numbers, arrays, and mathematical calculations. It’s essential for tasks that need numerical computing.
3. Matplotlib: A simple library for creating basic graphs like line, bar, and pie charts.
4. Seaborn: Built on Matplotlib, this library creates more detailed and advanced graphs like heatmaps or violin plots.
5. scikit-learn: A powerful library for building machine learning models like regression, classification, or clustering. It also includes tools for preparing data and evaluating models.
6. Jupyter Notebook: A tool where you can write code, explain your process with text, and visualize your results all in one place.
These tools and libraries make Python a perfect fit for every stage of data science projects, from data cleaning to deploying machine learning models.
Problem-Solving with Python: Practical Example
We will examine a real-world problem to illustrate how Python libraries and tools can be effectively utilized at each stage of the data science lifecycle.
Problem Statement
We have a dataset with details about houses, like their size in square feet, the number of bedrooms and bathrooms, the neighborhood, and the year they were built. Our goal is to use this information to predict the sale price of a house.
Goal
We want to build a regression model (because the price is a continuous value) that can predict a house's price based on its features. We will check how well the model is working using two metrics: Root Mean Squared Error (RMSE) and Mean Absolute Error (MAE).
Solution
The housing price data is stored in a CSV file. To work with this data and build our model, we will use a Jupyter notebook hosted online, along with Python libraries.
Price Prediction of Houses
This notebook demonstrates a workflow for predicting house prices based on various features using Python libraries.
Data Collection
Pandas provides utilities to read structured data, manipulate and analyze it
In this scenario, we have a csv file which can be read into pandas dataframe.
import pandas as pd

file_path = 'housing_price_dataset.csv'

housing_data = pd.read_csv(file_path)
Data Cleaning and Preprocessing
Let's look at the first 10 rows of the data using the DataFrame head() method.
housing_data.head(10)| SquareFeet | Bedrooms | Bathrooms | Neighborhood | YearBuilt | Price | |
|---|---|---|---|---|---|---|
| 0 | 2126 | 4 | 1 | Rural | 1969 | 215355.283618 |
| 1 | 2459 | 3 | 2 | Rural | 1980 | 195014.221626 |
| 2 | 1860 | 2 | 1 | Suburb | 1970 | 306891.012076 |
| 3 | 2294 | 2 | 1 | Urban | 1996 | 206786.787153 |
| 4 | 2130 | 5 | 2 | Suburb | 2001 | 272436.239065 |
| 5 | 2095 | 2 | 3 | Suburb | 2020 | 198208.803907 |
| 6 | 2724 | 2 | 1 | Suburb | 1993 | 343429.319110 |
| 7 | 2044 | 4 | 3 | Rural | 1957 | 184992.321268 |
| 8 | 2638 | 4 | 3 | Urban | 1959 | 377998.588152 |
| 9 | 1121 | 5 | 2 | Urban | 2004 | 95961.926014 |
From this we can infer that dataset has 6 columns:
- SquareFeet: Size of the house in square feet
- Bedrooms: Number of Bedrooms
- Bathrooms: Number of Bathrooms
- Neighbourhood: Categorical values: Rural, Suburb, Urban
- YearBuilt: Year the house was constructed
- Price: Sale Price of the house
Check for any missing values
Let's check the datatype of each column and make sure no placeholder is used by replacing it wih NaN.
We can use NumPy library to replace specific placeholder values with NaN
import numpy as np

housing_data.replace(["N/A", "none", ""], np.nan, inplace=True)
missing_values = housing_data.isnull().sum()
missing_values| 0 | |
|---|---|
| SquareFeet | 0 |
| Bedrooms | 0 |
| Bathrooms | 0 |
| Neighborhood | 0 |
| YearBuilt | 0 |
| Price | 0 |
0 for all columns indicates that there are no missing (null) values
Exploratory Data Analysis
Pandas DataFrame provides methods like info()to learn about the datatypes of the columns and describe() to view summary statistics for numerical columns.
housing_data.info()<class 'pandas.core.frame.DataFrame'>
RangeIndex: 50000 entries, 0 to 49999
Data columns (total 6 columns):
# Column Non-Null Count Dtype
--- ------ -------------- -----
0 SquareFeet 50000 non-null int64
1 Bedrooms 50000 non-null int64
2 Bathrooms 50000 non-null int64
3 Neighborhood 50000 non-null object
4 YearBuilt 50000 non-null int64
5 Price 50000 non-null float64
dtypes: float64(1), int64(4), object(1)
memory usage: 2.3+ MB
housing_data.describe()| SquareFeet | Bedrooms | Bathrooms | YearBuilt | Price | |
|---|---|---|---|---|---|
| count | 50000.000000 | 50000.000000 | 50000.000000 | 50000.000000 | 50000.000000 |
| mean | 2006.374680 | 3.498700 | 1.995420 | 1985.404420 | 224827.325151 |
| std | 575.513241 | 1.116326 | 0.815851 | 20.719377 | 76141.842966 |
| min | 1000.000000 | 2.000000 | 1.000000 | 1950.000000 | -36588.165397 |
| 25% | 1513.000000 | 3.000000 | 1.000000 | 1967.000000 | 169955.860225 |
| 50% | 2007.000000 | 3.000000 | 2.000000 | 1985.000000 | 225052.141166 |
| 75% | 2506.000000 | 4.000000 | 3.000000 | 2003.000000 | 279373.630052 |
| max | 2999.000000 | 5.000000 | 3.000000 | 2021.000000 | 492195.259972 |
Let's visualize the data using Matplotlib and Seaborn to explore the correlation between features and prices
import matplotlib.pyplot as plt
import seaborn as sns
Distrbution of House Prices
plt.figure(figsize=(10, 5))
sns.histplot(data=housing_data, x='Price')
plt.title('Distribution of House Prices')
Text(0.5, 1.0, 'Distribution of House Prices')
Bedrooms vs House Prices
plt.figure(figsize=(10, 5))
sns.boxplot(data=housing_data, x='Bedrooms', y='Price')
plt.title('Bedrooms vs. House Prices')
Text(0.5, 1.0, 'Bedrooms vs. House Prices')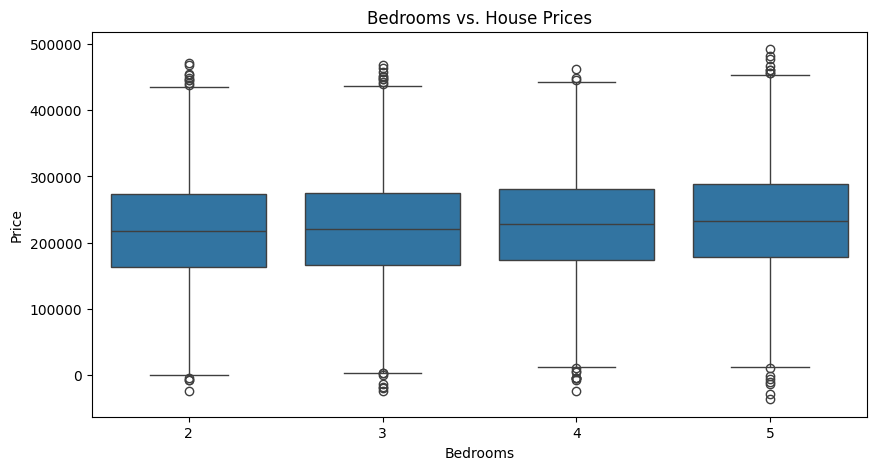
SquareFeet vs House Prices
plt.figure(figsize=(10, 5))
sns.lineplot(data=housing_data, x='SquareFeet', y='Price')
plt.title('Square Feet vs. House Prices')
Text(0.5, 1.0, 'Square Feet vs. House Prices')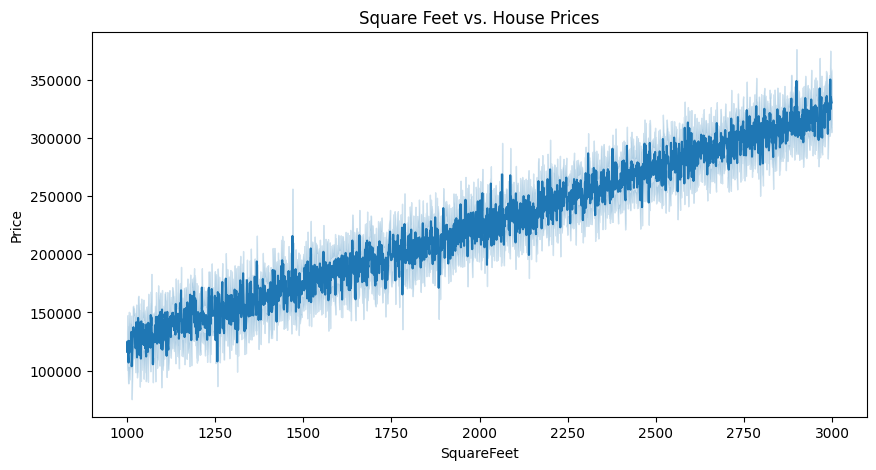
House Age vs House Prices
import datetime

current_year = datetime.datetime.now().year
housing_data['HouseAge'] = current_year - housing_data['YearBuilt']

plt.figure(figsize=(10, 5))
sns.scatterplot(data=housing_data, x='HouseAge', y='Price')
plt.title('House Age vs. Price')
Text(0.5, 1.0, 'House Age vs. Price')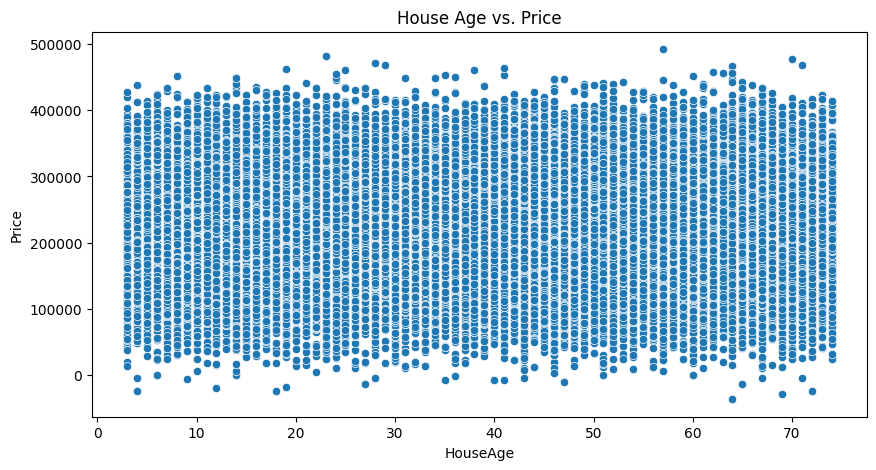
Correlation Matrix
Correlation Matrix is used to show relationship between the features with numerical data. Since, Neighbourhood is a categorical field, we need to convert it into numerical column by using One-Hot Encoding
Scikit-learn provides utility for this purpose.
One-Hot Encoding using Sci-kit Learn (sklearn)
from sklearn.preprocessing import OneHotEncoder

one_hot_encoder = OneHotEncoder(drop='first', sparse_output=False)
encoded_neighborhood = one_hot_encoder.fit_transform(housing_data[['Neighborhood']])
encoded_df = pd.DataFrame(encoded_neighborhood, columns=one_hot_encoder.get_feature_names_out(['Neighborhood']))

housing_data_encoded = pd.concat([housing_data, encoded_df], axis=1).drop('Neighborhood', axis=1)
housing_data_encoded.head(3)| SquareFeet | Bedrooms | Bathrooms | YearBuilt | Price | HouseAge | Neighborhood_Suburb | Neighborhood_Urban | |
|---|---|---|---|---|---|---|---|---|
| 0 | 2126 | 4 | 1 | 1969 | 215355.283618 | 55 | 0.0 | 0.0 |
| 1 | 2459 | 3 | 2 | 1980 | 195014.221626 | 44 | 0.0 | 0.0 |
| 2 | 1860 | 2 | 1 | 1970 | 306891.012076 | 54 | 1.0 | 0.0 |
plt.figure(figsize=(10, 5))
sns.heatmap(housing_data_encoded.corr(), annot=True, cmap='coolwarm')
plt.title('Correlation Matrix')
Text(0.5, 1.0, 'Correlation Matrix')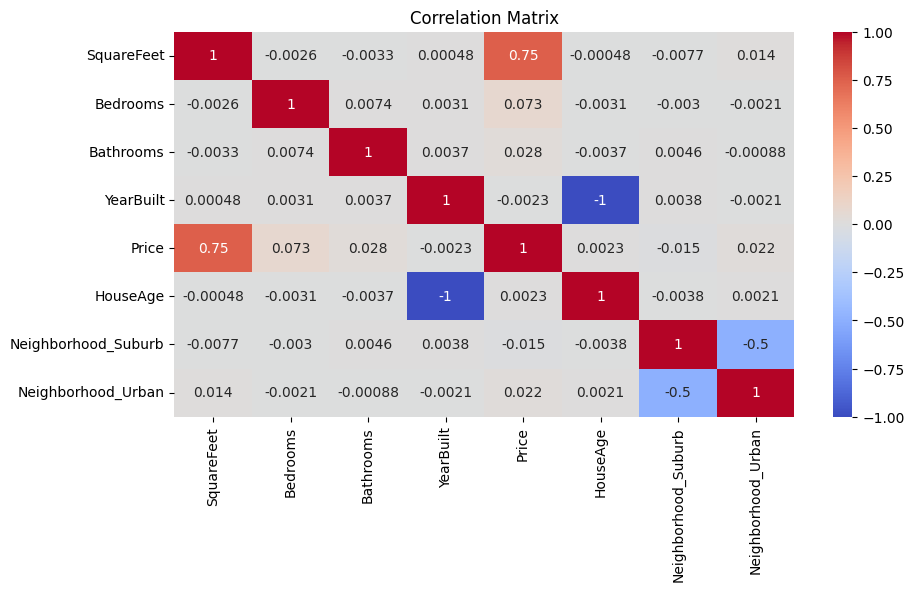
Feature Engineering
Let's create some new features to unlock some hidden relationships
Price Per SquareFeet
housing_data_encoded['PricePerSqFt'] = housing_data_encoded['Price'] / housing_data_encoded['SquareFeet']Mean Price by Neighbourhood
mean_price_by_neighborhood_suburb = housing_data_encoded.groupby('Neighborhood_Suburb')['Price'].transform('mean')
housing_data_encoded['NeighborhoodSuburbMeanPrice'] = mean_price_by_neighborhood_suburb

mean_price_by_neighborhood_urban = housing_data_encoded.groupby('Neighborhood_Urban')['Price'].transform('mean')
housing_data_encoded['NeighborhoodUrbanMeanPrice'] = mean_price_by_neighborhood_urban
Model Training and Evaluation
sklearn provides a wide range of models and utilities for building and evaluating machine learning models.
from sklearn.model_selection import train_test_split
from sklearn.metrics import mean_absolute_error, mean_squared_error

X = housing_data_encoded.drop('Price', axis=1)
y = housing_data_encoded['Price']

X_train, X_test, y_train, y_test = train_test_split(X, y, test_size=0.2, random_state=42)
from sklearn.linear_model import LinearRegression
linear_regression_model = LinearRegression()
linear_regression_model.fit(X_train, y_train)
y_pred = linear_regression_model.predict(X_test)
mae = mean_absolute_error(y_test, y_pred)
rmse = np.sqrt(mean_squared_error(y_test, y_pred))
print("Linear Regression Performance:")
print(f'Mean Absolute Error: {mae}')
print(f'Root Mean Squared Error: {rmse}')Linear Regression Performance:
Mean Absolute Error: 10917.728454376049
Root Mean Squared Error: 15339.472689214223
from sklearn.ensemble import RandomForestRegressor
random_forest_regressor_model = RandomForestRegressor(random_state=42)

random_forest_regressor_model.fit(X_train, y_train)
y_pred = random_forest_regressor_model.predict(X_test)

mae = mean_absolute_error(y_test, y_pred)
rmse = np.sqrt(mean_squared_error(y_test, y_pred))
print("Random Forest Regressor Performance:")
print(f'Mean Absolute Error: {mae}')
print(f'Root Mean Squared Error: {rmse}')
Random Forest Regressor Performance:
Mean Absolute Error: 359.56808451895427
Root Mean Squared Error: 595.4858304451691
Random Forest Regressor model is performing better than Linear Regression model as it has lower MAE and RMSE.
Conclusion
Python is a widely used programming language, especially in data science, because it’s simple to learn and work with, yet incredibly powerful. Its flexibility and the support from a large, active community make it a favorite choice for many. Python comes with essential libraries like Pandas, NumPy, and Scikit-learn that help throughout the entire data science journey, from handling and analyzing data to building and deploying machine learning models.
Just published


