Trusted by Market Leaders in Education, Travel, Finance and E-commerce since 2007


We put excellence, value and quality above all - and it shows


A Technology Partnership That Goes Beyond Code

“Arbisoft has been my most trusted technology partner for now over 15 years. Arbisoft has very unique methods of recruiting and training, and the results demonstrate that. They have great teams, great positive attitudes and great communication.”


Tracking User Engagement in Moodle with Custom Analytics and SQL Reports

If you’re using Moodle to run your classes, you’re sitting on a ton of info about what your students are doing. It’s like having a secret map to make your teaching way better! But let’s be real, most of us don’t dig into that data, and it just sits there.
When I first peeked into our Moodle data, I was blown away. Some lessons were totally ignored, while others were getting all the love. The clues were right there, but we weren’t looking! By using simple tools like custom SQL queries, you can answer stuff like:
- Which students need support before they fall behind?
- What kind of content is clicking with this class?
- When are students most active during the semester?
This post is about pulling out a few key things from Moodle to see how engaged your students are. We’ll talk about more metrics in the next one!
Moodle's Database Structure
Moodle stores all user interactions in its database. The key tables for tracking engagement include:
- mdl_user - User information
- mdl_course - Course information
- mdl_log - All user actions (pre-Moodle 2.7)
- mdl_logstore_standard_log - All user actions (Moodle 2.7+)
- mdl_course_modules_completion - Activity completion data
- mdl_grade_items and mdl_grade_grades - Assessment data
Login Frequency: How Often Are Students Logging In?
Want to know if your students are actually showing up to your online class? Checking how often they log in tells you a lot. Students who keep coming back usually do better, they’re staying on top of lessons and homework. It’s like taking attendance in a real classroom.
But here’s the red flag: if a student who used to log in all the time suddenly stops, something’s up. Maybe they’re missing deadlines or their grades are slipping. Spotting this early lets you reach out before it’s a big problem. Just a heads-up, logging in doesn’t always mean they’re paying attention. Some just pop in for a second. But if they’re not logging in at all, they’re definitely not engaged.
To track login frequency across your courses, you can use this SQL query:
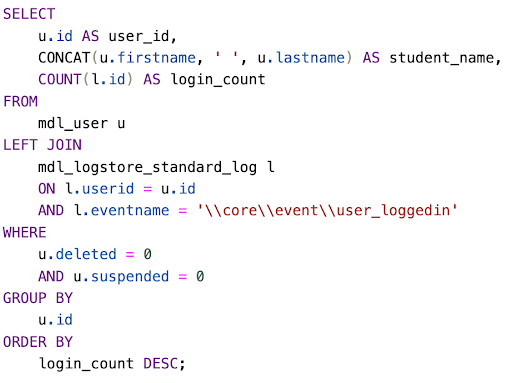
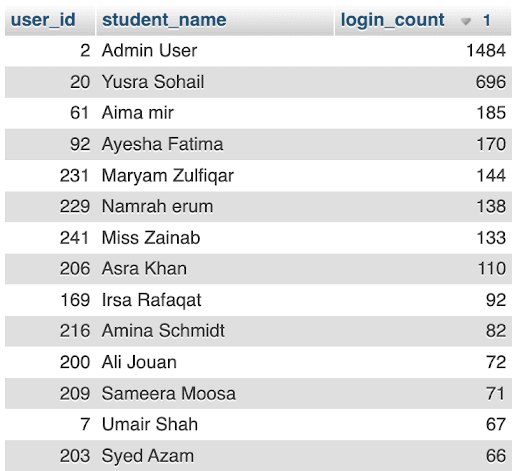
This query shows how many times each active student has logged into Moodle, listing the most active students at the top. A sample output looks like:
Time Since Last Login: When Was Their Last Login?
This one’s simple, it shows how many days it’s been since each student last logged in. Unlike just counting logins, this tells you who’s been missing in action lately. If a usually active student hasn’t shown up for days, they might be stuck, maybe tech issues, personal stuff, or they’re confused about the course.
Studies show that the longer a student stays away, the less likely they’ll finish the course. A quick check can help you see who needs help ASAP, so you can focus on them first.
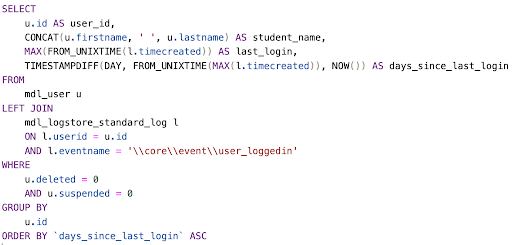
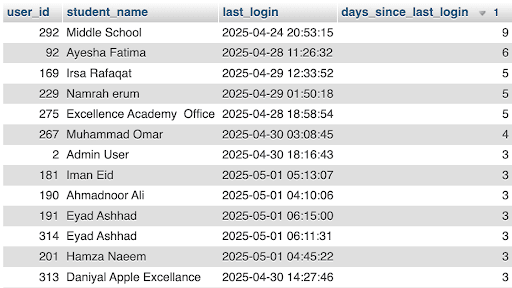
This query lists all active, non-deleted students along with the date of their last login and how many days have passed since then. It helps identify how recently each student accessed Moodle, showing the most recently logged-in students at the top.
Session Duration: How Long Are They Sticking Around?
Ever wonder if students are actually learning or just checking boxes? Short visits (like 1-2 minutes) usually mean they’re just peeking at grades or due dates. Longer sessions mean they’re diving into lessons, discussions, or activities.
If everyone’s sessions are super short, your content might not be grabbing them. If they’re spending hours on simple stuff, they could be struggling quietly. Tracking session length helps you spot who needs support and what parts of your course need a tweak.
To calculate average session durations for your students, you can use this SQL query:
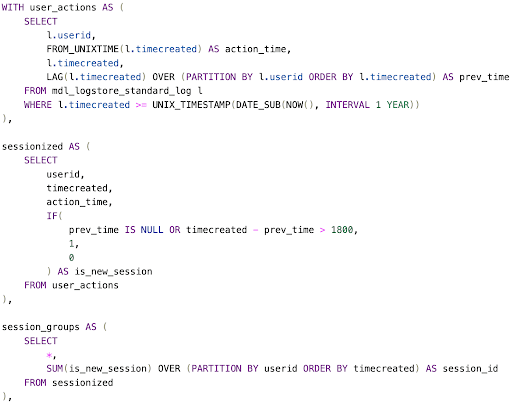
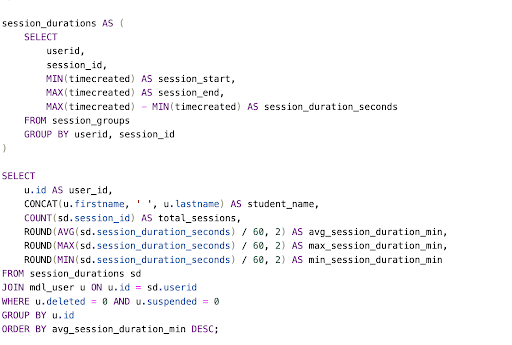
This query looks at each student's activity in the past year and groups their actions into sessions. Assume that a new session starts if there's a 30-minute gap. It then calculates how many sessions each student had, and how long their sessions were on average, as well as their longest and shortest session times.

This shows how much time each student is putting in overall. It’s like seeing who’s staying late to study versus who’s barely showing up. You can tell who’s really grinding on assignments, reading, or reviewing feedback. It also highlights which lessons might need clearer explanations or extra resources.
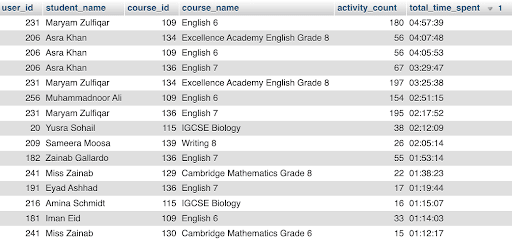
To track the total time students have invested in your courses, use this SQL query:
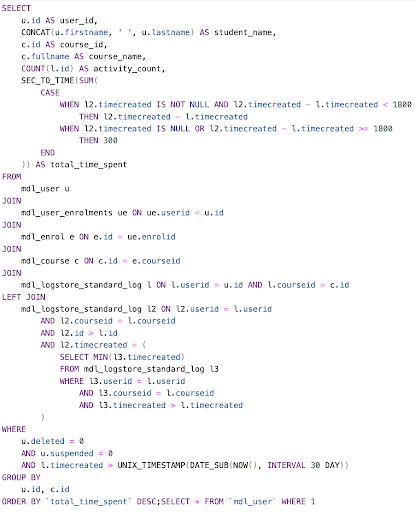
This query shows how active each student has been in each course over the past 30 days. It counts their actions and estimates the total time they spent based on activity gaps, with the most time spent listed first.
Daily & Weekly Active Users
Is your course buzzing or turning into a ghost town? Checking how many students show up daily or weekly gives you the big picture. You’ll see which days are busy and if your course keeps people hooked.
Good courses have steady patterns, with spikes around deadlines. If you notice fewer people showing up over time, it’s a sign something’s off—not just for one student, but maybe the whole class. This helps you spot what’s working and what needs fixing.
To track your active user trends over time, you can use this SQL query:

This query shows your course engagement data to show daily and weekly active user counts.
It's tracking which students are actually utilizing your course, not just viewing. Calculating both daily and weekly unique participants and comparing those numbers against total enrollment gives you engagement percentages.
The results show you which courses have the highest engagement rates, helping you identify both successful course designs and potential problem areas that need attention.
The data covers the last 60 days of activity, giving you a recent picture of student participation patterns.

Next Step
You can pull this info from Moodle’s database and save it as spreadsheets. Turn that data into action by making a simple dashboard with tools like Google’s Looker Studio or Power BI to spot trends and find students who need help. Set up weekly reports to keep an eye on things, like reaching out to anyone who hasn’t logged in for a week or whose activity drops.
In The End
This isn’t just about watching students, it’s about making your course better. If some lessons keep students glued, make more like that. If certain days are super active, drop big announcements then. Using this data means you’re teaching based on what your students actually do, not just guessing.
Just published