Building Real-Time Learning Analytics on an Open-Source Stack for an Online Learning Platform
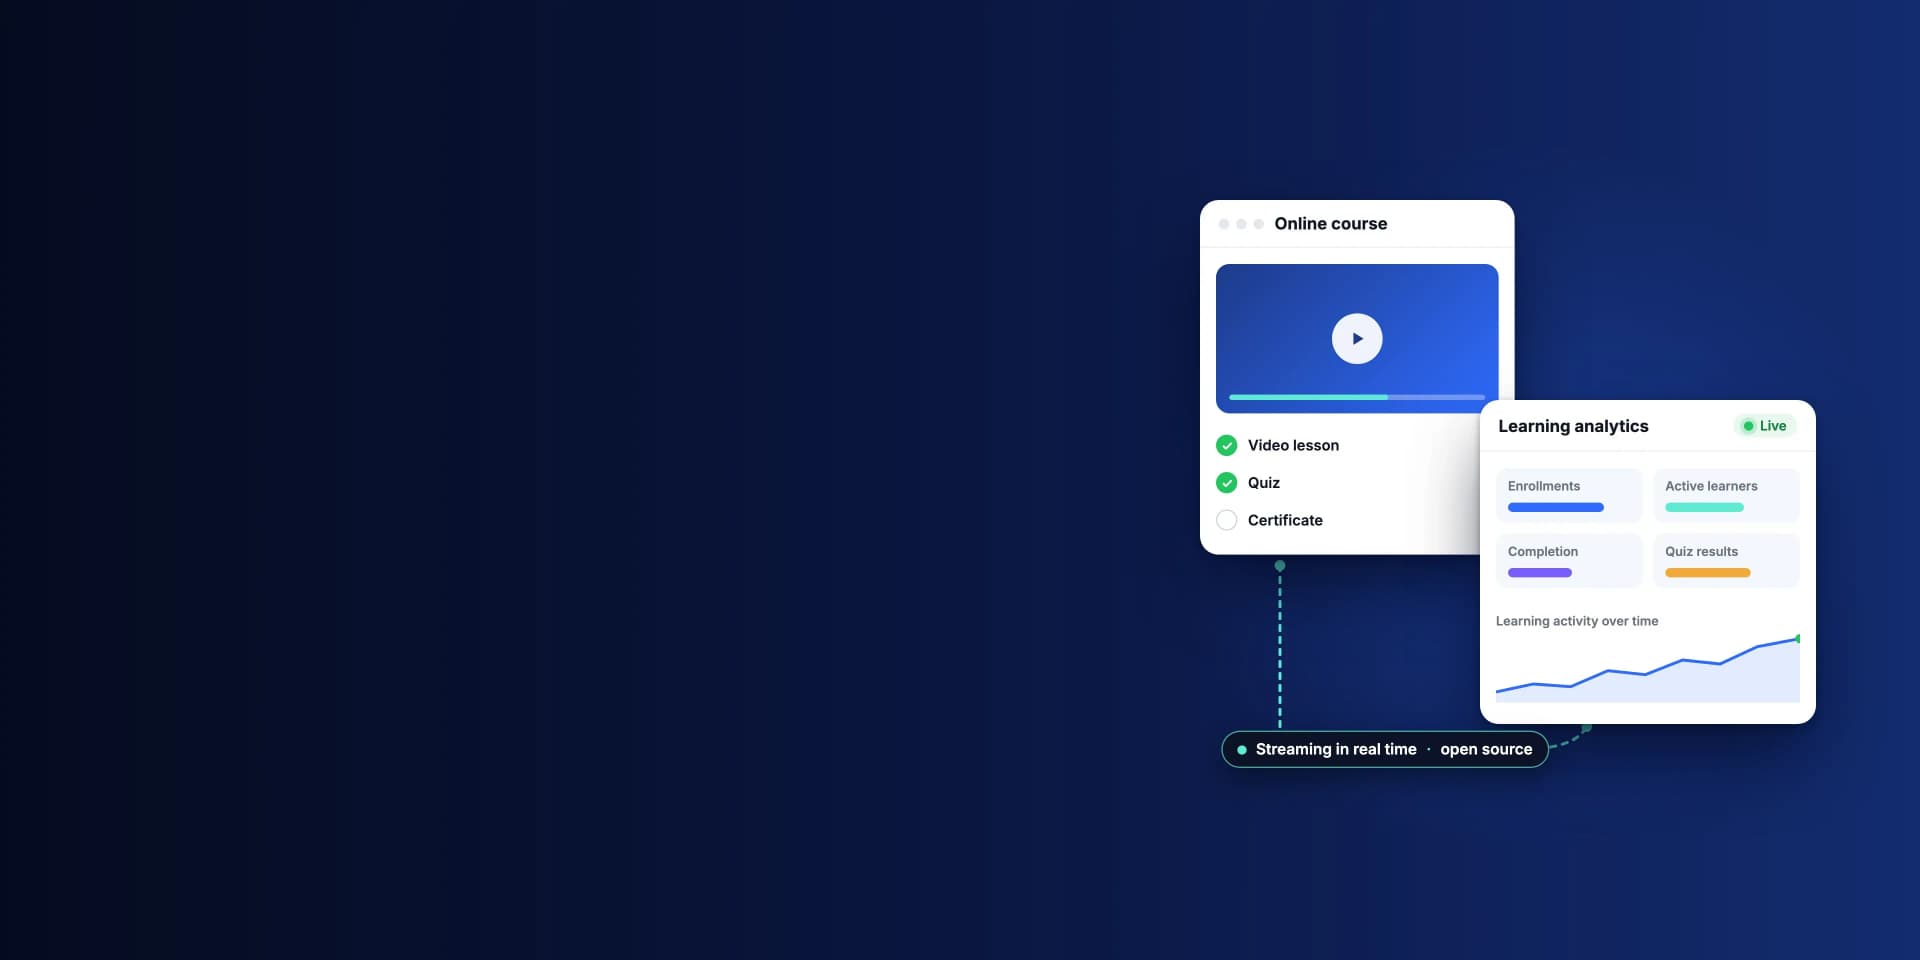
Arbisoft built a real-time analytics platform entirely on open-source technologies. Vector streams operational data into ClickHouse, Apache Superset turns it into dashboards, and reporting no longer touches the production database.
Client/Partner
Confidential
Industry
Education
Service Offered
Data Engineering & Analytics
Tech Stack Used
The client operates an online learning platform. Its business and academic teams needed to see learner engagement, course performance, and platform usage as it happened, and the platform's transactional database was never built for that kind of reporting.
Arbisoft designed and built a lightweight, real-time analytics platform entirely on open-source technologies. Vector streams operational data into a dedicated ClickHouse warehouse, and Apache Superset turns it into interactive dashboards.
The result is near real-time visibility into learner activity, reporting that no longer loads the production database, and an analytics stack that avoids expensive proprietary platforms.
Introduction
The client operates an online learning platform where learners enroll in courses, watch videos, and attempt assessments. Business and academic stakeholders needed actionable insight into learner engagement, course performance, and platform usage, without relying on expensive proprietary analytics platforms.
The platform's transactional (OLTP) database was optimized for application workloads, not analytical queries. Running reports directly against it hurt application performance and could not deliver the responsiveness that operational dashboards need.
The client needed a partner who could deliver real-time insight without putting the production application at risk, and do it on an open-source stack.
The Challenge
The core problem was that analytics and the application were competing for the same database. The client needed a solution that could:
- Deliver near real-time analytics: Learner and course activity had to be available with minimal latency.
- Protect the production database: Reporting could not be allowed to affect the OLTP database that serves learners.
- Support high-performance analytical queries: Dashboards needed to respond quickly, which the OLTP database could not provide.
- Stay open source: An open-source technology stack was required to keep licensing costs down.
- Serve business and academic stakeholders: Interactive dashboards had to work for both groups.
The Approach
We designed a lightweight analytics platform that keeps analytical work off the production database entirely. Operational data is captured continuously, streamed into a dedicated analytical warehouse, and served through self-service dashboards. The design has four parts:
Streaming Data in Real Time
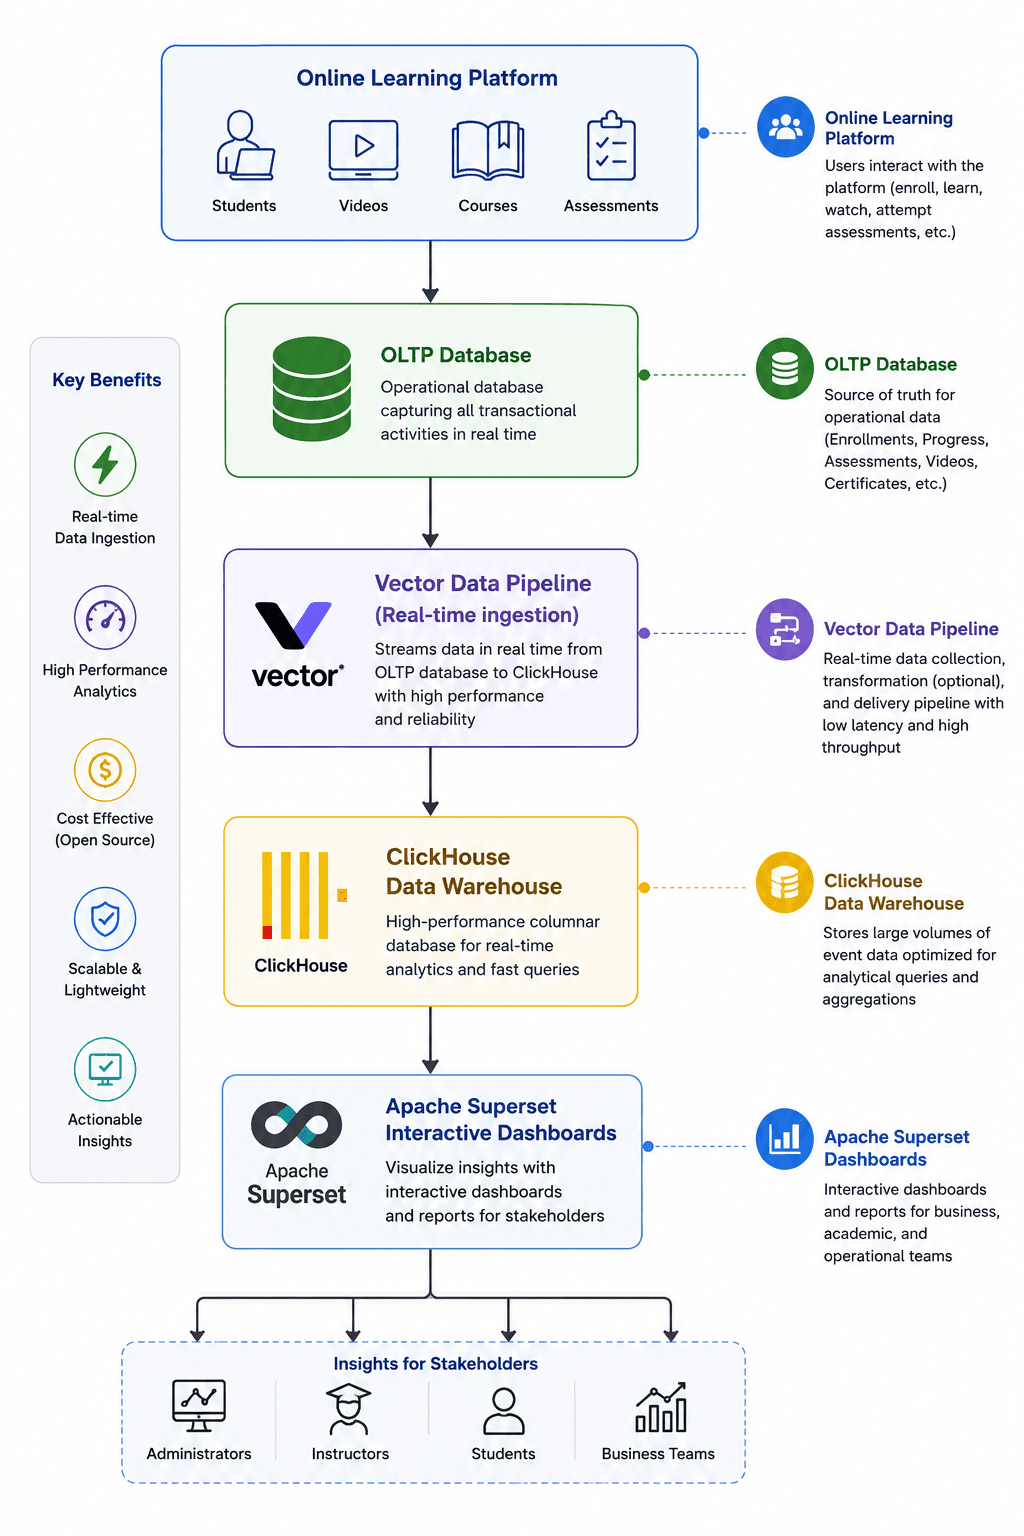
We used Vector, a high-performance observability and data pipeline tool that processes streaming data with very low resource consumption, to move data from the operational database into ClickHouse. The ingestion layer provides:
- Continuous synchronization from the operational database
- Near real-time data availability for reporting
- Lightweight ingestion with minimal infrastructure overhead
Keeping Analytics Off the Production Database
The architecture separates transactional and analytical workloads. Dashboards query a dedicated ClickHouse data warehouse, so they stay fast, and the production application stays responsive.
Fast Queries at Scale
ClickHouse is a high-performance columnar database built for real-time analytics. It runs analytical queries across millions of records, supporting:
- Aggregations
- Time-series analysis
- Drill-down reporting
- Interactive filtering
Dashboards for Every Stakeholder
Apache Superset sits on top of ClickHouse. Business users can explore platform activity through self-service dashboards without needing technical expertise, and role-based access controls who sees what.
What the Dashboards Show
The platform delivers comprehensive operational insight across four areas:
- Learning activity: total course enrollments, active learners, course completion rates, and certificates earned
- Student progress: progress tracking by learner, module-wise completion percentages, and learning journey analysis
- Content engagement: most viewed videos, most popular courses, course engagement trends, and learning activity over time
- Assessment analytics: assessment participation, quiz and exam results, performance distribution, and pass and fail trends
The Technical Architecture
The diagram below shows how activity on the learning platform flows from the OLTP database through Vector into ClickHouse, and out to Apache Superset dashboards for administrators, instructors, students, and business teams.
The Outcome
The platform gave the client's teams a live view of their learning business, without adding reporting load to the application that serves learners.
- Near real-time visibility into learner activity, so teams can monitor course performance as events occur.
- Better decisions, supported by operational dashboards that stakeholders can explore themselves.
- No reporting load on production: analytical queries no longer run against the production database.
- Lower infrastructure and licensing costs, from an entirely open-source stack.
- Room to grow: analytics capabilities can scale as the learning platform continues to grow.
This project shows how a modern open-source data stack can deliver enterprise-grade analytics without the complexity or cost of traditional data warehouse solutions. Vector handles ingestion, ClickHouse handles high-performance OLAP processing, and Apache Superset handles visualization, which together give stakeholders timely, actionable insight into learner engagement and educational outcomes.
Technology Used
The open-source stack behind the platform:
- Data Source: OLTP database
- Data Ingestion: Vector
- Analytical Database: ClickHouse
- Business Intelligence: Apache Superset
- Deployment: Self-hosted open-source infrastructure